The Signalflow concepts to learn, for easier charts, alerts and to spend less time in Splunk

It can be frustrating using Signalflow for the first time. Charts appearing with no data, or detectors going off that shouldn’t, and stuff not making sense. If you’ve ever stared at a flat line (or no lines!) on a chart wondering why your metrics aren’t showing, or been confused about why aggregation doesn’t work as expected, this post is for you.

If you are not familiar, SignalFlow is the query language used in Splunk Observability Cloud for analyzing metrics.

I’ll assume you are:

  • Using Splunk Observability Cloud metrics with Signalflow queries.
  • Want to observe how your services are performing, if there are bugs, performance issues or service degradation.

This post aims to get you to a place where you can quickly troubleshoot queries, avoid trouble in the first place, and spend less time on this part of your job. To do that, I go over some key concepts, that once you understand, will solve most puzzling things about your Signalflow queries not doing the right thing.

The concepts are listed below, and we’ll tackle them one by one.

Metrics – Basic Definitions

Let’s define a couple of terms related to metrics:

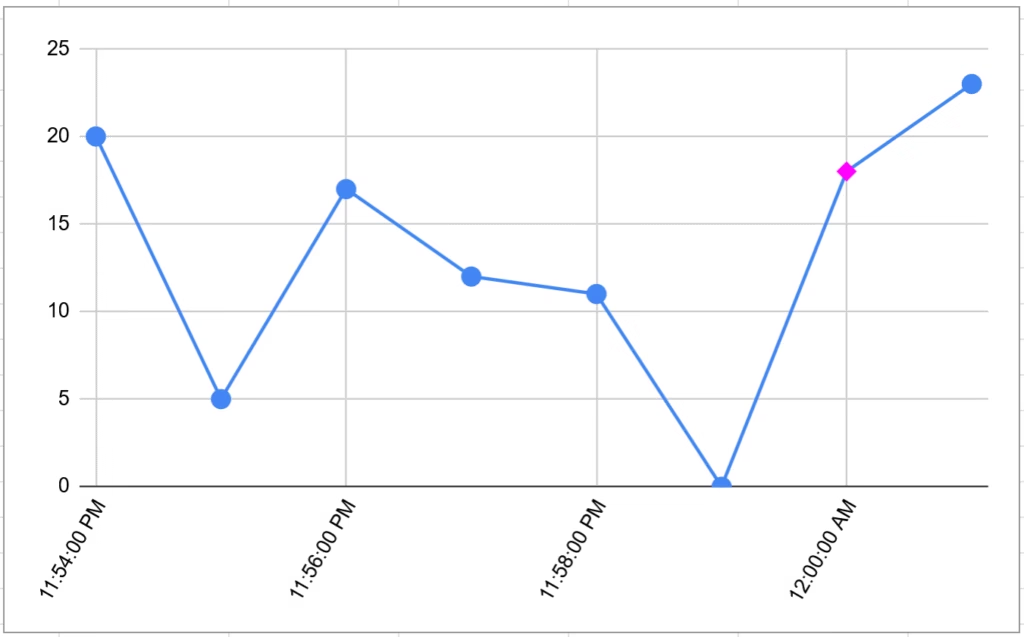
A metric is a single measurement at a specific point in time, e.g. (2026-01-04 00:00:00, 18), visualized here, with metric shown as pink diamond:

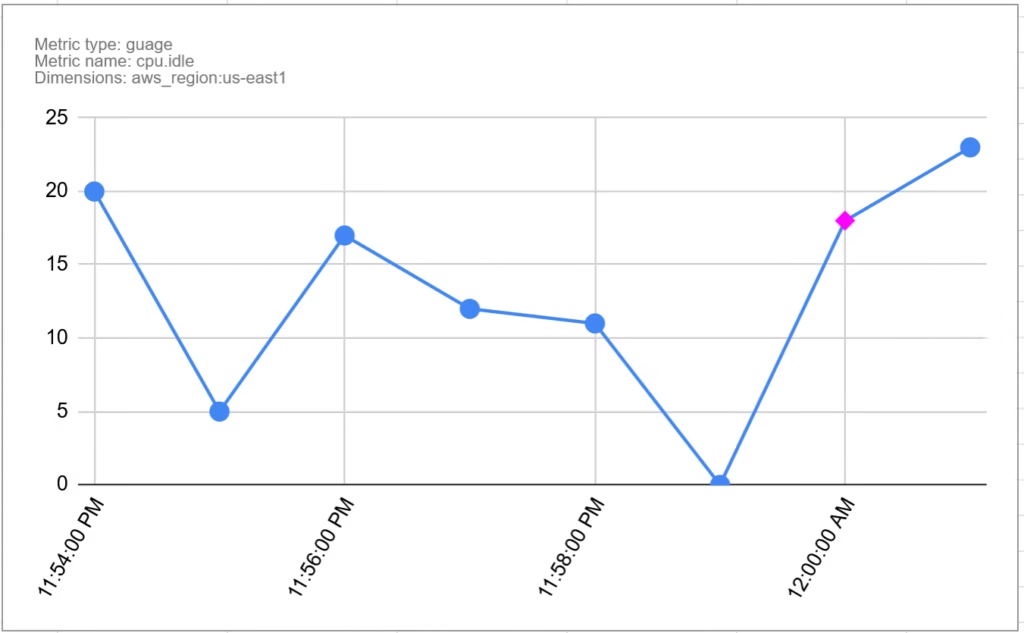
A metric data point is a metric with some metadata. It has the following values:

  • Timestamp — the time — usually to 1 second precision, can be lower resolution if configured.
  • Metric value — e.g. 15
  • Metric type — can be counter, cumulative counter, or gauge:
    • A counter counts events since the last report
    • A cumulative counter counts events since process start
    • A gauge measures a value at a point in time (e.g., current CPU usage)
  • Metric name — e.g. cpu.idle
  • Dimensions — a set of key-value pairs to tag the data point. Can be anything, example is aws_region:us-east1

This is shown below. It is the same chart as before with the additional metadata, and the pink diamond is now the metric data point:

Metric Time Series, or MTS

A metric time series (MTS) is a collection of data points that have the same metric and the same set of dimensions. In other words, it is a series of Metric Data Points. For example:

Time Value Details
11:54:00 PM 20

Metric Name:

cpu.idle

Dimensions:

aws_region:us-east1

11:55:00 PM 5
11:56:00 PM 17
11:57:00 PM 12
11:58:00 PM 11
11:59:00 PM 0
12:00:00 AM 18
12:01:00 AM 23

There is an MTS for every recorded combination of:

  • Metric Name, e.g. cpu.usage
  • Metric Type, e.g. gauge
  • Unique set of dimensions, e.g. hostname:server1,location:Tokyo

Note: it is possible to have two metrics with the same name and different types, but it is best not to do that. They discourage it in the docs here.

Dimensionality

There is an MTS for every combination of dimension values. The number of MTS grows quickly as dimensions are added, or new values added to dimensions.

For example, if you have a metric, with a server dimension with 100 values, and an operation dimension with 50 operations, and all combinations get used, you have 5000 metric time series. Having thousands isn’t necessarily a problem, but having many millions might be.

This is why we try to avoid high dimensional in metrics. For example if you use a URL as a dimension, the problem could be it may include query data, e.g. /user/1003332/post/8883 which would create a lot of time series.

Data Blocks

Now we know how the data is represented, the start of any SignalFlow query is the data block. The data block is where you define which metric(s) you want to gather data from, what filters you want to apply.

For example:

data('cpu.utilization', 
     filter=filter('host', 'hostA', 'hostB') and filter('AWSUniqueId', 'i-0403'))

This creates a data stream based on the metric cpu.utilization, and uses filters to only pick up data for specified values of dimensions. In details:

  • The data block defines that we want to extract data from MTS, and specifies the name of the metric.
  • The filter parameter defines how we want to filter all the MTS streams down the the ones we need.
  • The output of this is the collection of MTS streams for the metric name that have the dimensions specified by the filter.

This is combining the various MTS into a single stream. In this case, it is combining all of these:

  • All cpu.utilization MTS with host=hostA and AWSUniqueId=i-0403
  • All cpu.utilization MTS with host=hostB and AWSUniqueId=i-0403

If there are other dimensions, then there can be multiple MTS with the same host and AWSUniqueId that need to be combined.

The data block produces a stream, but to produce a chart the engine must bucket values up into time intervals, e.g. 1 minute or 1 day. What is the time interval set to? Can you control it? On to that next.

Resolution

The resolution defined the period of time MTS are bucketed in to for analysis. For example it could be 1 minute, and therefore the Metric Data Points will be aggregated into 1 minute buckets for the purpose of charting and rollups.

The use of an unexpected resolution can easily trip you up, especially when using detectors and debugging why a detector did or didn’t go off given the sent data. We might cover detectors in a future post, but if you are not familiar they are rules to trigger alerts on certain conditions.

SignalFlow usually determines the single resolution for a job by following these steps:

  1. Determining the resolution for long transformation windows or time shifts that retrieve data, for which only a coarser resolution is available.
  2. Analysis of the resolution of incoming metric time series.

You can control the resolution in part 1 by using the resolution parameter of the data block. Resolution coarseness caused by Part 2 is also worth watching out for, you can experiment and remove time shifts etc and see if this reduces the resolution to what you expect.

Here is an example of setting a 1 hour resolution on a datablock:

data('cpu.utilization', 
     filter=filter('host', 'hostA', 'hostB') and filter('AWSUniqueId', 'i-0403'),
     resolution='1h')

Rollup vs. Analytics

There are two types of aggregation that happen in Signalflow, and this really had me puzzled for a while, as why do I want to aggregate twice, and what happens if I choose a different aggregation for them?

The difference is Rollup aggregates over time, and analytics aggregates over dimensions. Let’s dive into that a bit more.

Rollup

A rollup decides how to aggregate the MTS into the given time resolution. For example given this MTS from earlier, let’s do an average rollup over a 2 minute resolution. The result is every 2 minutes, we take the mean average of the (in this case) 2 values. Here is the original MTS again:

Time Value Details
11:54:00 PM 20

Metric Name:

cpu.idle

Dimensions:

aws_region:us-east1

11:55:00 PM 5
11:56:00 PM 17
11:57:00 PM 12
11:58:00 PM 11
11:59:00 PM 0
12:00:00 AM 18
12:01:00 AM 23

Here is the rollup:

Time Value Rollup
11:54:00 PM 20 12.5
11:55:00 PM 5
11:56:00 PM 17 14.5
11:57:00 PM 12
11:58:00 PM 11 5.5
11:59:00 PM 0
12:00:00 AM 18 20.5
12:01:00 AM 23

For the example we only looked at one MTS, but of course the rollup applies to all of the combined MTS in the query. The resolution as mentioned earlier is determined by factors including the original stream resolution, the specified resolution in the data block, and any other operations that may make the resolution courser.

Analytics

Analytics methods allow you to aggregate again—this time over dimensions. By default, i.e. if you don’t use analytics, you get a stream for every single combination of dimensions. You may sometimes see charts with so many colored lines it is hard to read. These probably have not been aggregated using analytics.

You can aggregate all of those lines into a single line using an aggregation function of your choice. Choices of function include count, floor, mean, delta, minimum and maximum. More details are here.

The example below shows this, on the left, without analytics, there are 2 MTS shown as separate lines. If we then apply the mean analytic function, we get a single line with the mean:

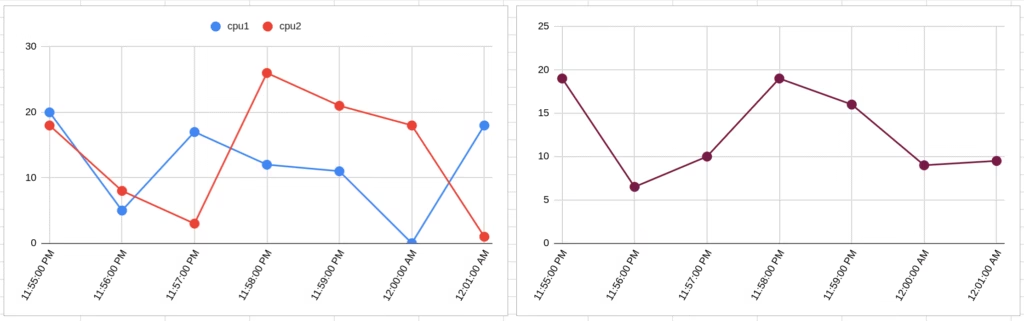
As signalflow code, these would look something like:

data('demo.cpu.utilization').publish('chart1')
data('demo.cpu.utilization').mean().publish('chart2')

Maybe you don’t want to collapse all lines into one line? Then you can also choose to group by dimensions. For example if you have MTS with dimensions for cpu number and host, you could do this:

data('demo.cpu.utilization').mean(by=['host']).publish()

Which would give you the average cpu utilization across cpus for each host.

Hopefully this helps you get started with Signalflow. Finally here are some entry points into Splunk documentation if you want to read more:

Image by PublicDomainPictures from Pixabay

Production tests: a guidebook for better systems and more sleep

Your customers expect your site to be fully working whenever they need it. This means you need to aim for near-perfect uptime not just for the site itself, but for all features customers may use.

Modern software engineering uses quality control measures such as automated test suites and observability tools (tracing, metrics, and logs) to ensure availability. Often overlooked in this landscape is production tests (also known as synthetics) that can give you immediate notification of failures in production.

Production tests can be setup up with minimal fuss—usually within one sprint—and can provide a high return on investment. In this post, I will cover how to best set up production tests and how they can help with reliability, deployments, and observability.

While I have always liked production tests, I got a real appreciation for them at Atlassian, where they are used extensively and are called “pollinators”, and I have seen first hand how they can give early warnings of problems, which can be fixed before the become incidents.

What are production tests?

A production test is any automated test that runs on the production environment. The test runs on a frequent schedule so that an on-call engineer can respond quickly. Typically, they run every minute. The test might use a headless browser to emulate user actions, or it may use an API directly to emulate the actions of browser code or backend service.

The production test should run in a reasonable time. I suggest 30 seconds or less, so that you can run the test easily once per minute. A test that takes longer than 30 seconds is probably to complex anyway for a production test. How the test deals with failure is up to your team. It could integrate with your on call paging system, send a Slack notification, or just log an error into your logging systems.

How do production tests help?

Productions tests help make your production environment more reliable by giving immediate warning of a regression. This means you can potentially fix issues before a customer discovers them.

In addition, the production test can be used as a canary before deployments, and as such acts as an integration test. The test can detect regressions that are caused by mismatches with other services, such as API shape or error-handling issues. You can run the test when deploying to development and staging environments too, to get a warning of an issue during development.

You also make it easier to debug production issues by having production tests. If you have an issue you are investigating, knowing which production tests are working and are failing gives you insight into what the issue might be. If you rely on other team’s services, and they also have production tests, you can look at their tests too to help with diagnostics.

Having production tests will reduce the time to recovery for any incident where a human has to fix it, as the engineer learns about the issue sooner, and has more information at hand to resolve it.

Important design considerations for production tests

For production-tests to be worth having, they need to be well-thought-out. If the test keeps failing it’ll probably get silenced and ignored. Even if the test is reliable it can cause other problems, such as resource usage impacting downstream systems. You may even have to change your systems to be a bit more testable. Here are some tips to consider when setting up your production tests:

Keep your production tests basic

Your production tests should cover less ground than your automated test suites. You want the tests to be reliable enough that they don’t waste your time with false alerts, which leads to frustration, lost time and possibly disabling of alerts. The goal of a production test is to be the canary that something has gone badly wrong. It gives you a head start on fixing it, hopefully before a customer gets affected.

To illustrate the required simplicity, here are some examples of what I think are good candidates for a production test:

  • Log in, and confirm you are on the home page, showing that user’s name.
  • Load the main editor of your app and type in Hello. Confirm Hello is there. Reload the browser and confirm Hello is still there.
  • Call 4 API endpoints to do CRUD operations for your microservice, using possibly some fake data in the API.
  • Ping /health and check for 200 response code within 250ms

Contrast this with these more complex and problematic production tests:

  • Run through a 25-step test that checks all the main functionality of the editor, asserting that elements are the correct size and are in the correct position.
  • Test that if you make call in quick succession to the API, they will be added to the database in the same order.
  • Check that the credit card page can differentiate between Visa and Mastercard based on the card number.
  • Ping /health and check for 200 response code within 1.5ms

The first examples are good because they are quick, reliable, and simple. They are not too functionality-specific, are so are unlikely to be broken by feature changes.

The bad examples on the other hand have problems:

The 25-step test will likely be flaky due to browser automation quirks, and feature changes. You will spend a lot of time investigating failures to the test, and concluding “It was just a one-off” or “Oh! It’s because we moved a button”.

The API calls in quick succession will sometimes fail due to network conditions changing the order in which the requests are received. It is not necessary to do something sophisticated in a production test—your goal is to know if something is horribly broken, not detect subtle timing issues.

The credit card test is probably OK in terms of not being flaky, but is a little too specific. You can almost entirely de-risk a bug in credit card UI behavior with tests that run before deployment, so do that instead.

The health check test expecting a fast response is likely to fail often enough to cause alarms that have no meaningful response. There are better ways to monitor latency in production that I will cover in a future post.

But… try go get some decent coverage

You are not aiming for anything near 100% code coverage, in fact code coverage doesn’t really matter here. That said, production tests should cover more than just “load the home page”. This is an art, but a guiding idea here is “if there is a serious problem, how likely are my production tests to detect it”. You are balancing that up with “how frequently will I get false reports of an outage”.

You also may want to think about the value of the things you are testing. Is it a minor feature used by 1% of users, or is it the page where new customers sign up? The latter is particularly important for growth companies who rely a lot on customer self-servicing to try out their software.

You don’t have to get this completely right from the beginning. You can add more tests next week. Furthermore, you can edit your existing tests, or even remove them too. Err on the side of too little coverage to begin with and consider adding more later. This way your team will get used to owning, tweaking and responding to production tests, without a cacophony of alarm bells!

As a rough guide, I would say test 3-5 simple things to begin with, with the goal to eventually move towards a reasonable amount of coverage. What is reasonable? You’ll find out after trying things out, and discussing outcomes with your team. There is no correct answer here.

Production tests are not health checks, but may overlap with them

A health check is usually a simple check that the server is running. For example, if using Node.js and Koa or Express, you might add a health route that just returns a success response on any invocation.

The purpose of this check is to assess basic server health. It allows load balancers to know which nodes to send traffic to, and deployment pipelines to know when a deployment has completed (or failed).

We expect these health checks to fail in production, possibly without affecting the customer. For example if a machine goes offline, the load balancer will detect this and stop sending traffic to that node. However, if there is no adverse effect of this on the consuming service or customer then there is no urgent problem. The system has self-healed.

Calling this health check on a node as a production test is not advisable, as it will cause false alarms. Even if it didn’t, a health check is not a good indicator of user experience.

The term “Health check” is also sometimes used to refer to checks that do more that just check the server is up. E.g., they may check dependencies such as storage systems, caches, queues and so on. A production test that calls such a health check could give early warning of an issue before it becomes noticeable by customers.

Be mindful of how your production tests affect observability

Running a test every minute, or 1440 times a day, will show up quite a lot in logs, metrics, and traces. This is often a good thing, because regions or services with very low traffic are now a bit more “observable” than they would be without such tests.

The downside is it may add costs by keeping resources spun up in those regions. Another downside is that being fake traffic, and sometimes requiring fake data (such as a fake user ID) can add noise to the logs you will sometimes need to filter out.

Fake data considerations

Consider a monolithic application — a single server that serves a website and all of its functionality. You need to write a test that logs in, enters some data in a field, saves it and checks it got saved. Such a test has a few challenges.

Firstly you need to decide how it logs in. Does it have a real account? If it does—what stops that account from expiring (e.g., from a free trial). You may need a discount code or special “fake credit card” that the system knows is for testing. If it is a “fake” account then how does that work? Is it hard coded somewhere.

The test is now generating data on each run. Will the success or failure of a previous run affect the current run of the test. Will running the test thousands of times a week use up storage space?

Think about these issues when planning the tests.

The tempting thing is to do the easiest thing to get it done. E.g., create an account using your staff email, worry about storage later, just get it working. This can come back to haunt you if the test breaks later, and you need to deal with upgrading the account, or maybe the member of staff whose email was used is on leave.

Making a production system testable may take some work and have special switches, such as user fields, or feature flags so that the behavior can be slightly different to facilitate the test.

If you use microservices, or a monolith with a separate auth service, there are ways to avoid needing a test user account. For example if your service uses a JSON Web Token (JWT) to authenticate, the authentication server could support logins for test systems, and your service can declare which tests it is authorizing to call it.

Three strikes before an alarm

If you have enough production tests, and run them on enough systems for long enough you will get false alerts. These can be caused by all sorts of things, network problems that only affect the test side, quirks in browser automation, or a genuine problem that heals itself two seconds later.

The simple way to avoid getting these kinds of false alerts is to wait for three consecutive failures before raising any alarm.

You might be giving me a side eye right now though, because should we be ignoring these false alerts? Probably not. If you have a team ritual of looking through operations data, you can incorporate non-alerting production rest failures into that ritual. The idea is that you prioritize it like any regular work, rather than making it an urgent thing that requires people to work out of hours, or stop their regular work.

Pros and cons of production tests

What is good about testing in production? I have hinted at a few of these already, however let’s get into the details:

  • Real world testing: Test suites—including unit tests and locally-run integration tests—that run on every build are definitely needed. However, even with all of there is nothing quite like test-driving the finished car, and that is what production tests are for. The proof of the pudding is in the eating.
  • Quality Control: The main reason for running tests is to know something is broken. Despite all the automated and manual testing you do on your machine and in staging environments, production is always unique. There are some things that only happen they way they do in prod. And even if your staging environment is precisely the same, generally speaking production will have more traffic. Running tests in production let you know if certain things are working in production.
  • Troubleshooting: If there is an incident where customers are impacted by a bug or outage, the tests are very useful. They may be failing or passing, but either way, their current state tells you something about the system, and can help narrow down the problem.
  • Observability for low traffic regions: If you deploy your service to multiple regions and some of those regions don’t get much traffic, the production tests will create synthetic traffic. Your observability metrics such as latency and reliability percentiles will be more meaningful with even just 1000 calls per day, than with close to zero traffic.
  • Safer Deployments: The same tests you use to monitor production can double up as tests you run to accept a blue/green deployment. These tests are then acting as continuous integration tests of last resort, adding to the assurance that your deployment won’t cause big issues.
  • Reuse in other environments: Just as you can use these tests for safer deployments, you can also use them in dev and staging environments, to get early detection of issues that your build pipeline cannot detect, such as integration issues with other services.

There are, of course some disadvantages to using production tests:

  • Setup and teardown challenges: Tests run on the real system, so you cannot wipe the database before each run. You need to figure out how to best set up the specific scenario you want to test for, and how to clean up after the test.
  • They sometimes need setup of scenarios: For example you have a test than you can upgrade your account, but you need an account set up that needs to be upgraded, and a fake payment method that will be accepted. These scenarios may mean changing production code to support them too.
  • They can be flaky: Any test that runs on a real system can fail from time to time for various reasons. For example network issues between the test and the service or occasional timing issues in the browser the test uses. Flakiness of tests needs to be taken into account if you intend to wake someone up when the test fails.
  • They cause resource usage and costs: Running tests do cost. Often tests are run across different geographic regions to ensure they are tested well, and hundreds of times a day. That compute cost adds up.
  • Human cost in maintaining tests: Not every test fail is an issue, but it does need to be investigated. Too many tests could leave you with a full-time position monitoring and making those tests more robust.

Production tests, vs. observability

You can also “test production” though monitoring of real traffic, and looking for problems there. This deserves a post or series of its own, but in short you can check for things like:

  • Latency, e.g., alert me when the top 99-percentile of latency for a particular endpoint is > 200ms, for 3 periods in a row.
  • Reliability, e.g., alert me when more than 0.1% of requests fail with a 5xx code.
  • Assertions, e.g., alert me when a code path that is considered unexpected or impossible has been triggered.
  • Failures, e.g., alert me when a customer couldn’t perform a task because they got an error.

The good thing about observability-based alerts is they are very simple to set up. It may need some minor code changes, and then setting up detectors in observability tools, that take look for and take an action when the condition is met.

These tests pair well with production tests. They have a different purpose though, since they detect problems after they have happened, and they piggyback on existing system use. They can be helped by production tests creating additional synthetic traffic which they can then monitor, which lets you keep checking things when natural traffic levels fall off.

There is no “versus” though! You would do well to have both. For a particular need it might be better to use a production test or better to use observability. A rule of thumb is if observability can meet the requirements of alerting you to a problem, then it will be easier to set up and tune to your needs than a production test.

Summary

Phew! We covered a lot of ground there. In a nutshell adding well-designed production tests to your systems will help in a number of ways. You’ll get earlier warnings of issues, you will be able to fix them faster, you will get observability benefits, and you can also use production tests as a deployment rollout test.

It is worth adding production tests if you are not doing so already—it is a relatively small task to fit in to your planning, and you will reap rewards. If you are already using them, keep reviewing them, and see what you need to add, remove and tweak to get the most value from them as your systems evolve.

Happy testing!

Human-made Content