Weekly AI Learnings #2

Detour — Prompt Caching

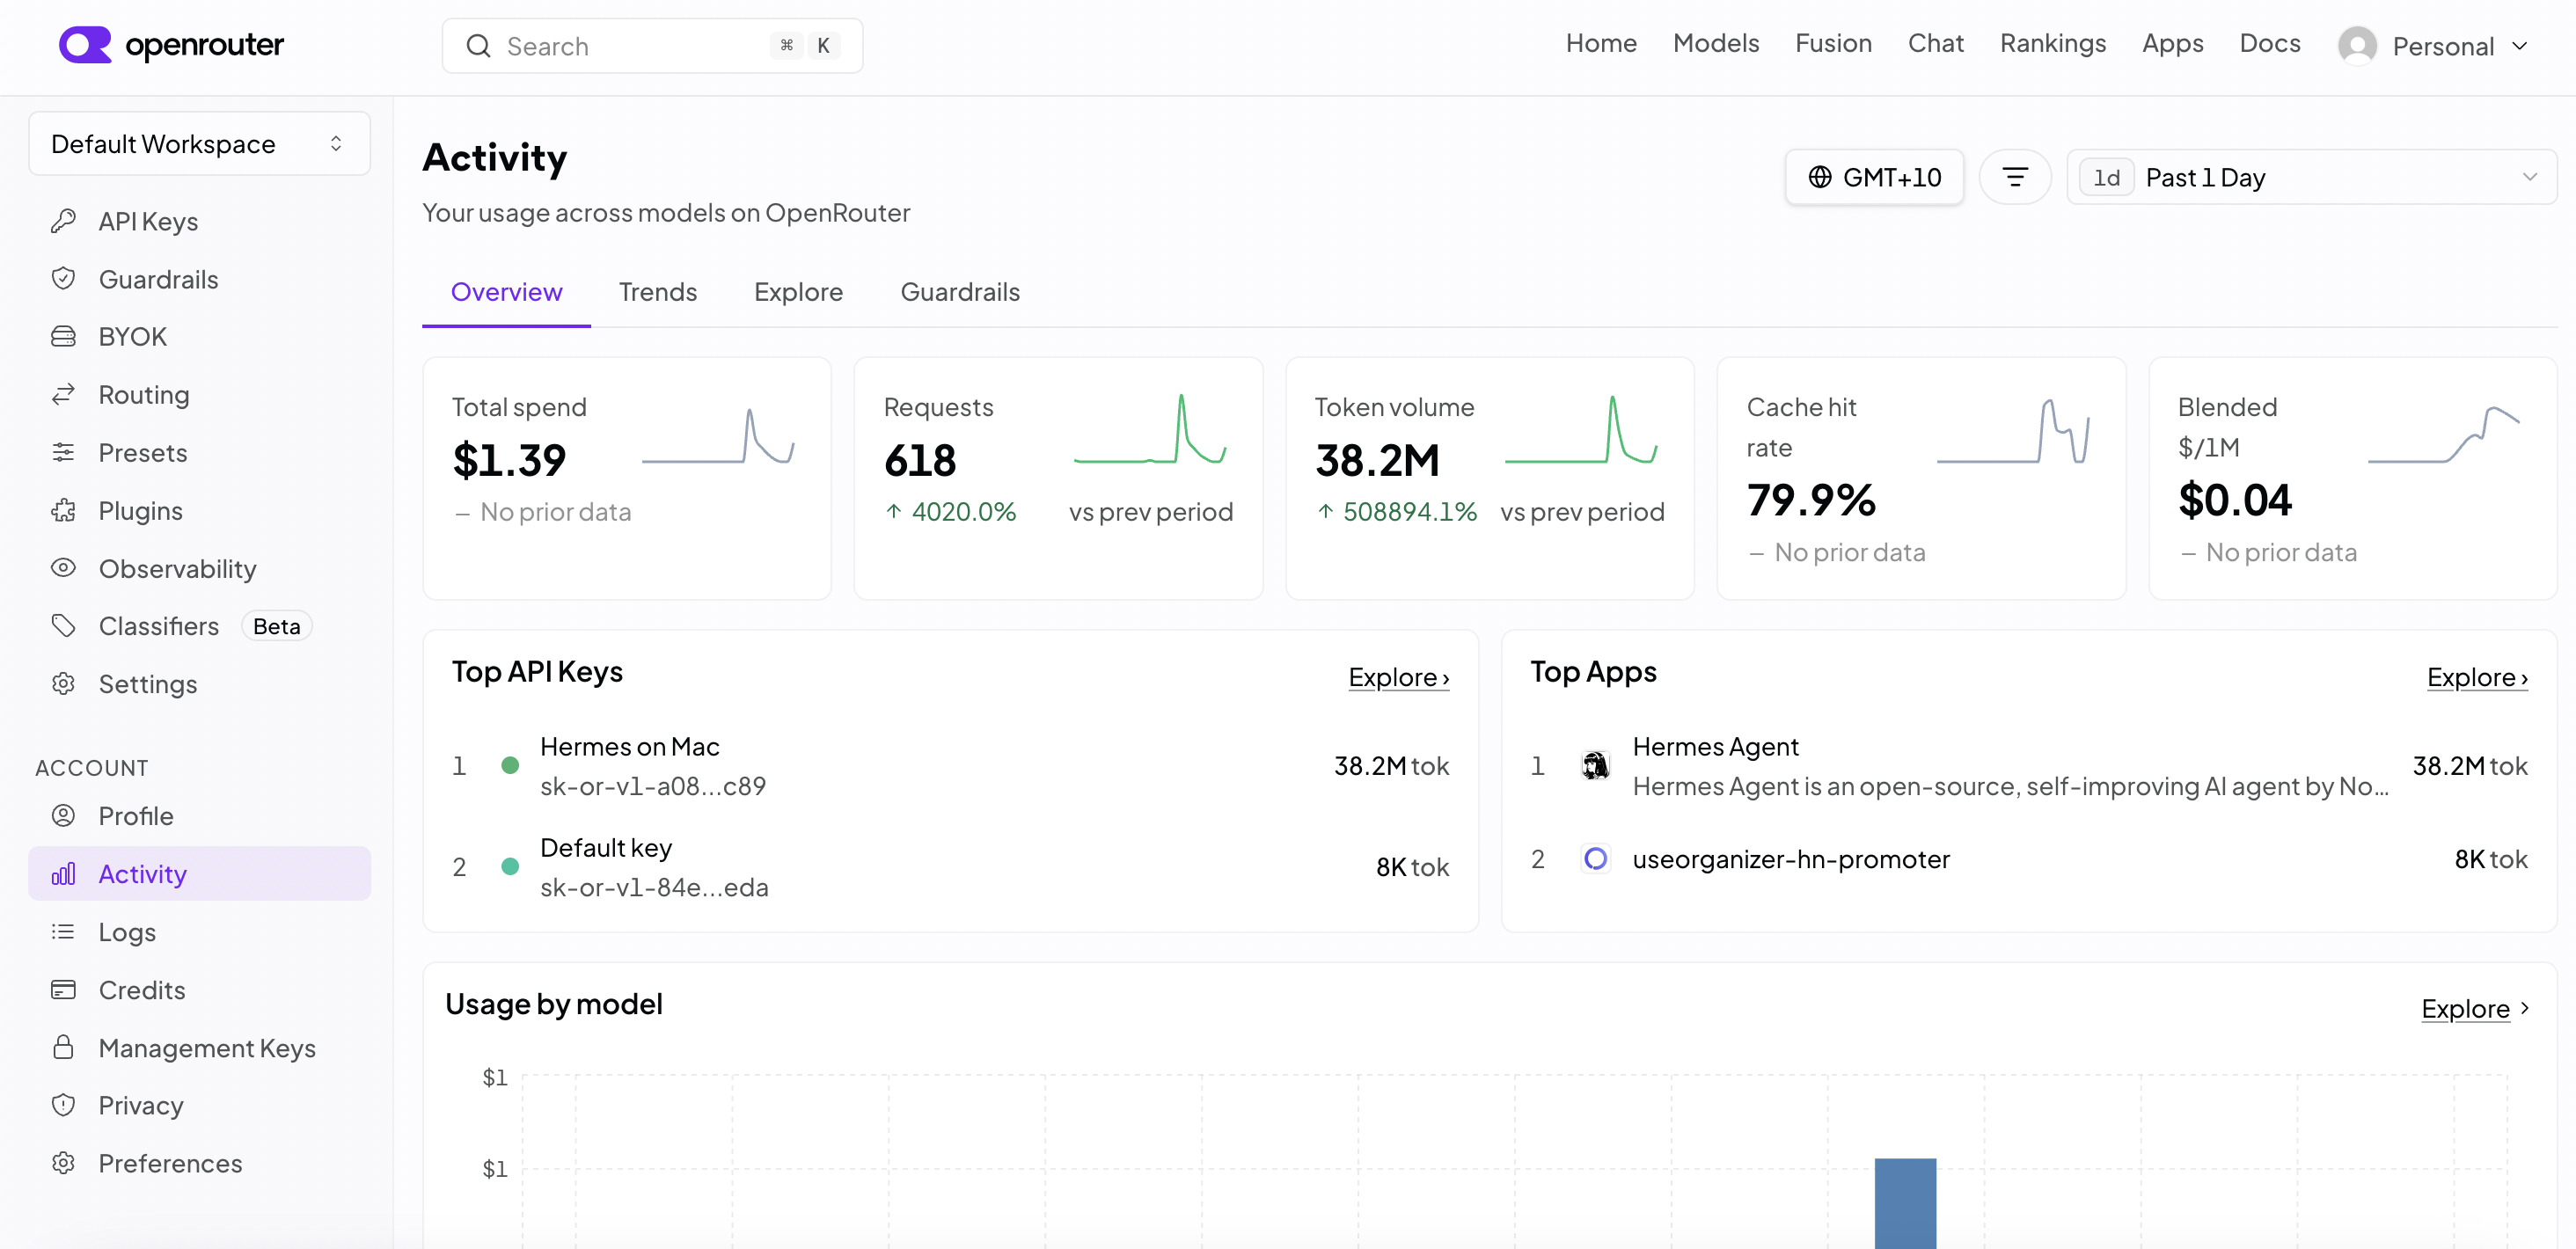
This was an impromptu find. I came across https://kreidemann.com/blog/prompt-caching, it is mostly about prompt caching security and timing attacks, but it does introduce the concept of KV cache well and highlights this can be the system prompt shared by all users, or system + messages making your next turns faster and cheaper (for someone) as they hit the cache. This image is pretty good:

This rabbit hole links to https://sankalp.bearblog.dev/how-prompt-caching-works/ and https://ngrok.com/blog/prompt-caching. I read just the second one for now, and it is excellent. Fairly intense, as it explains attention from mostly from scratch, to the extent it helps explain the KV-cache. I don’t think we probably need to understand all that and the simplified version above is enough intuition to understand the cache. Basically as you run through each token from start to finish you do a calculation. Each calculation depends on the previous. Each token builds upon the last. Therefore, you can cache intermediate calculations. It is kind of like memoization it seems.

My takeaways:

  • Reminder — there is a cache!
  • It saves someone money, either it is you the consumer, or the model provider if you are paying a fixed monthly amount, or paying the same per token regardless of caching.
  • It works well with system prompt, as everyone gets the same one. There is a huge efficiency boost, plus no security worries.
  • It also works well with your sessions/prompts, but if sharing these caches across tenants, they may need to be wary of timing attacks.

Original Destination — How Does That Agent Work?

Following on from Weekly AI Learnings #1, I wanted to study how a real life agent works. The agents I am interested in are OpenCode and Pi, and I don’t fully understand how they compare/contrast yet. I have briefly used OpenCode but not Pi.

I have chosen Pi to look at first, mainly because I stumbled across agent-loop.ts, and thought this looks fairly straightforward to read. Maybe OpenCode has such a file, but didn’t find it yet.

I feel like I need to understand a few basics of this code, so git clone https://github.com/earendil-works/pi/ it is.

EventStream (packages/ai/src/utils/event-stream.ts) looks a lot like a Goroutine channel. It has a push, which will send “events” to a listener. A listener which subscribes via an iterator. If there is nothing being pulled, events get queued up. And if there are no events, pulls get queued up and wait for them. There is also a mechanism to close the stream, with a judge function that determines if an event is terminating, along with another function that produces a final result from that closing event. This seems like a useful building block object to have in an agentic system.

Knowing what EventStream is helps me understand agentLoop, which returns said stream, using type AgentEvent for the event, and AgentMessage[] for the result. Agent Events are looking like “stuff the agent does” such as messages and tool calls. This looks neatly organized so far:

export type AgentEvent =
	// Agent lifecycle
	| { type: "agent_start" }
	| { type: "agent_end"; messages: AgentMessage[] }
	// Turn lifecycle - a turn is one assistant response + any tool calls/results
	| { type: "turn_start" }
	| { type: "turn_end"; message: AgentMessage; toolResults: ToolResultMessage[] }
	// Message lifecycle - emitted for user, assistant, and toolResult messages
	| { type: "message_start"; message: AgentMessage }
	// Only emitted for assistant messages during streaming
	| { type: "message_update"; message: AgentMessage; assistantMessageEvent: AssistantMessageEvent }
	| { type: "message_end"; message: AgentMessage }
	// Tool execution lifecycle
	| { type: "tool_execution_start"; toolCallId: string; toolName: string; args: any }
	| { type: "tool_execution_update"; toolCallId: string; toolName: string; args: any; partialResult: any }
	| { type: "tool_execution_end"; toolCallId: string; toolName: string; result: any; isError: boolean };

The EventStream constructed is one that looks for agent_end as the stop signal, and when that happens the results are its messages. At this point I have no idea how this hangs together, but I guess there is some accumulation of messages going on somewhere.

Honestly I have looked ahead at more of the code, and it seems hairy, while also being compact and clever. It’ll be fun reading it all and seeing how it works. I was naively hoping to understand the whole thing in one go, but I’ll wait for next week’s post to go deeper into it.

Image by Zerro Energy from Pixabay

Making this site a little faster

This site runs on WordPress on a cheap hosting plan, with W3TotalCache and Cloudflare in front of it to hopefully make it a bit faster. It turns out my quick setup of bundling this all together wasn’t making the site as fast as I assumed. We’ll talk about how I found out and what easy steps made it quite a bit faster, while still using the cache and Cloudflare.

Recently I found I could speed up this site in simple ways—ways that don’t involve writing code. I found this when I was experimenting with a tool called Locust which load tests services. Let’s look into that a bit more.

Locust

Locust is a performance load testing kit, written in Python. It is easy to install and run if you have Python set up (try to have 3.13 if you have a choice to run Locust). Just do this:

python -m venv .venv
source .venv/bin/activate
pip install locust
locust -V

Then create a locustfile.py like this

from locust import HttpUser, task

class HelloWorldUser(HttpUser):
    @task
    def hello_world(self):
        self.client.get("/")
        self.client.get("/images/someimage.jpg")

Then run locust

locust

And visit http://0.0.0.0:8089/

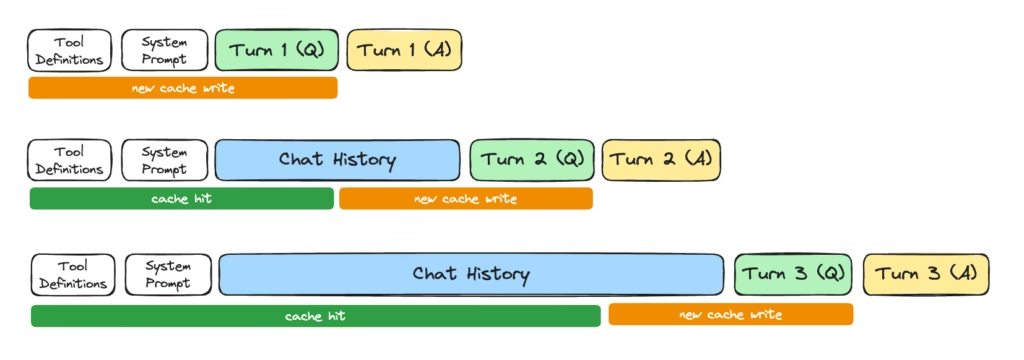
You will be asked for number of users, ramp up and host. Going with 1, 1 and https://martincapodici.com/, the system will then start polling those endpoints, and reporting stats:

We now have some stats on latency statistics e.g., median latency, 95%ile and 99%ile. If you are not familiar, the 95%ile (or p95) means the latency at which that 95% requests are lower latency (faster), and 5% are higher latency. Higher percentiles like p95 and p99 are useful to get a feel of what the more slow cases are.

The latency includes time to finish the request having downloaded the response body. Therefore, the larger image does take longer, as you would expect. This is heavily influenced by my internet connection. A quick test of which is 91.2 Mbps download / 28.1Mbps upload. Based on that a ~2.16 MB images = 17.28Mb = 189ms to download. By calculating 200-189, we get an inferred ~11ms to process request to the first byte for p50.

The above stats are the optimized versions, and it was worse before, and I’ll go into how bad and what the those optimizations are.

Before we do that notice the GET / is a lot slower, 290ms. That is because the images are behind a CDN, whereas I chose not to cache the HTML on the CDN yet. This means it crosses from somewhere in the US to where I am, adding a lot of network latency. Adding HTML to the CDN is doable, but needs a bit of configuration to avoid the cache interfering with admin/login, and for a low traffic blog this latency for the HTML part of the request is OK for now.

What is a CDN? A CDN solves the latency problem by caching copies of the file in servers in hundreds of cities. The network latency you local city can be as low as 1ms so it makes a huge difference. This is done using things like GeoDNS, Anycast IP Routing, and more.

Things that were slow

On the earlier runs of Locust, latency of the HTML home page / was much higher, I think around 2 seconds p95!

Next, there was only the PNG image and not the more highly compressed AVIF format, and you can see the difference between those two in the test results from before.

Finally, in addition to Locust I ran Google Lighthouse to look for slowness. It found a redundant JS download, and removing this saved about 800kb uncompressed / 200kb compressed. It was a math formula (TeX) renderer bundled with the theme, that I do not need.

Why the slow home page?

The reason for that 2 second latency was a simple lack of caching in WordPress itself. First I had an old cache plugin-in that broke the current one as it didn’t properly get uninstalled. Then on top of that W3TotalCache requires you to opt in to page caching.

Claude helped me diagnose this, which it did really well with just curl commands. Because of this it also noticed the header specifying a 7-day limit for caching, i.e., max-age=604800, which could lead to some people seeing old versions of the home page without the latest post. It was fixed by changing the .htaccess file to reduce the default to 0.

With the page now actually cached, the latency dropped from 2 seconds to the current 500ms p95 — with even better results if you are browsing from the US as much of that latency is the network.

The AVIF improvement?

AVIF is a recent file format which has gain widespread adoption. It is based on the AV1 video format. There are two parts to serving these, one is to have them ready to serve, and the other is to detect if the browser can support them and decide whether to server the older format or AVIF.

To do this without paying for a dedicated service required a couple of plugins, Modern Image Formats (by WordPress Team) and Regenerate Thumbnails. The former will generate the WebP and AVIF files for each image, and serve them when supported, and the latter lets you do the one-off conversion if you haven’t been generating them before.

These speed-ups are great, better for user experience, better for slower connections, better for the environment too!

Image by PublicDomainPictures from Pixabay

Weekly AI Learnings #1

This is a series where I talk about trying to learn more about AI tools, with the goal of learning practical skills to solve problems both in life and at work.

Current State

I know basically how LLMs work e.g., by doing the zero-hero course a while back, and I use AI almost exclusively for writing code at work using Rovo, and now looking at how do I effectively “harness” things to get the best results, waste less time, avoid tech debt and so on.

I am also interested in automated agents and how they can be useful, how to avoid slop from whatever source wasting human time, and when—like I am now for writing this post—not to use AI at all.

This week

This week I started with Building effective agents, which is a 2024 Anthropic article. I have a walnut set up on my personal context manager that I am using to guide me about what to learn, and it suggested this. I questioned it that it is from 2024, which is a bit old in this fast moving world, and Claude said something along the lines of:

Why it ages well: it was written at the concept level, not the tooling level. It covers workflow vs. agent distinction, five patterns and core advice.

So I gave it a read. My notes are below.

Building Effective Agents: My Notes

It starts of defining words—a very useful thing to do for common understanding. I have pasted below from the article:

  • Workflows are systems where LLMs and tools are orchestrated through predefined code paths.
  • Agents, on the other hand, are systems where LLMs dynamically direct their own processes and tool usage, maintaining control over how they accomplish tasks.

Here are the advantages of each:

AgentsWorkflows
+ Task Performance
+ Difficult and open-ended problems

— Potential for compounding errors
+ Lower Latency
+ Lower Cost
+ Predictability and Consistency

I learned of existence of the agent SDK, which “includes built-in tools for reading files, running commands, and editing code, so your agent can start working immediately without you implementing tool execution.” It also plugs a couple of GUI tools: Rivet and Vellum.

Rivet and Vellum look very useful and polished, and that makes me wonder how they compare to the OpenClaw and Hermes hype of 2026.

In any case, Anthropic recommend developers use API directly, I guess for the obvious reasons (I won’t spell it out, but you know if you have been writing code for some time). Nonetheless, those tools look fun to play with.

It defines augmentations and the diagram mentions query/results, call/response and memory. One of the talks at this meetup mentioned the analogy here with your operating system, something like LLM is compute, memory is RAM, MCP is calling out to the internet maybe, stuff like that.

Then these workflow concepts:

  • Prompt Chaining — What it says on the tin I guess. Do one prompt, then do another. Perhaps with a gate between. Means the LLM can dedicate more attention to each task (my view). Tradeoff is better performance at task, for higher latency and maybe cost overall.
  • Routing — You can route to the right LLM. Possibly the best LLM for the job, or maybe the most cost-effective. It doesn’t mention how to route, but I imagine this could be anything from simple pattern matching/regex to using a classifier, to asking a cheap model to classify, or even asking the human. My guesses.
  • Parallelization — obvious use case is for speed, you have things that can be done at the same time. Also, good for sectioning I guess a bit like chaining above to focus more attention on two aspects of the same problem. There is also voting, e.g., approach the same issue from different angles then combine (their example is look for vulns). I also think this is where you could send to OpenAI and Claude and compare what they say, although this article ain’t going to say that of course!
  • OrchestratorWorkers — I just see this as dynamic parallelization with an LLM in charge. This is the classic thing Claude Code does all the time.
  • Evaluator — Optimizer — LLM evaluates result from another LLM. A loop to repeat until the evaluator is happy.

Agent concepts:

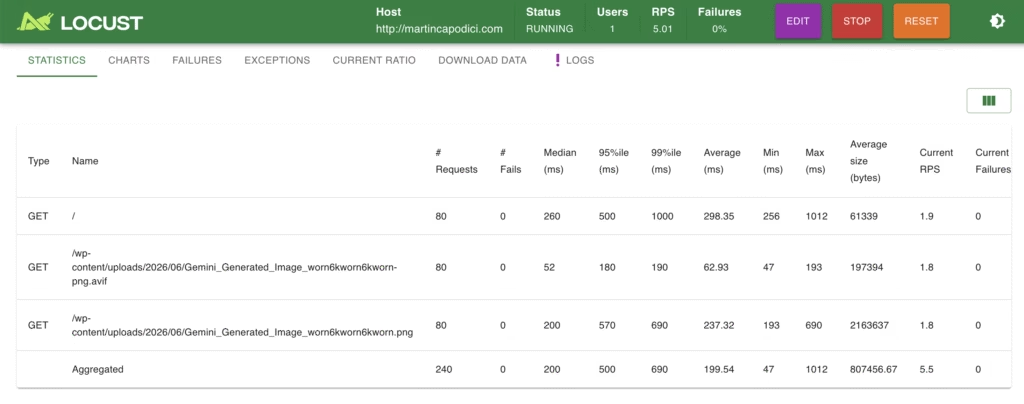
There are many fantastic diagrams in the article, but the one I will copy is this about Agent loops, saying how simple they are at the core:

Examples are coding agents and computer use.

It doesn’t go much deeper than this — it is a conceptual article. I think I could learn a lot by looking how specific agents such as OpenCode work, which would be interesting to know.

When implementing agents, we try to follow three core principles:

  1. Maintain simplicity in your agent’s design.
  2. Prioritize transparency by explicitly showing the agent’s planning steps.
  3. Carefully craft your agent-computer interface (ACI) through thorough tool documentation and testing.

Appendix items

  • Agents in practice — they say why customer support and coding agents are good fits for using agents (I think as opposed to workflows) and I agree with that. Whether customer support agents > humans I am not sure, but I have used good customer support agents before. The Dell one is particularly good as it runs on your computer so knows your setup, can do scans then book support for you, for example.
  • Tools — Mentions tool use, in which LLM sends a stop block to invoke tool use. There are some suggestions on tool formats, but I wonder if those are more for the models of the time, or today if you decide to use cheaper models. However, thinking about formatting coming out of tools is good to save context and money.
  • Workbench — there is a workbench to test tools — workbench
  • Pokayokehttps://en.wikipedia.org/wiki/Poka-yoke, interesting concept: “is any mechanism in a process that helps an equipment operator avoid mistakes and defects by preventing, correcting, or drawing attention to human errors as they occur”

Experiment

My walnut session then advised to do this tutorial https://ampcode.com/notes/how-to-build-an-agent, which is pretty fun and quick to get going on.

Luckily I know Go, although if you don’t, you can have it converted to Python — it might be more educational to do that manually though.

Anyway this takes you through:

  1. First you build a simple take-turns chatbot. To fix the terminal characters, replace \\\u with \u in the listing, and you will have to change the model as the one they specify no longer exists. Other than that it works.
  2. Then you add tool use, they give you a gotcha for fun — they add the tool request without checking the LLM response and using the tool, so it does nothing. Then show you the code to complete this. You now have a bot that can decide to read a file if it wishes to.

What is interesting is the tool use is programmed in so you get a real feel for what is going on, but it is sort of built into Anthropic’s API, so there is some magic there, but I guess that is the way it is when the models are trained on tool use and have magic tokens or whatnot that you don’t get to see. How that works and is trained is something I would like to go deeper into at some point, but not a priority now.

Feature image generation: Nano Banana 2

The Signalflow concepts to learn, for easier charts, alerts and to spend less time in Splunk

It can be frustrating using Signalflow for the first time. Charts appearing with no data, or detectors going off that shouldn’t, and stuff not making sense. If you’ve ever stared at a flat line (or no lines!) on a chart wondering why your metrics aren’t showing, or been confused about why aggregation doesn’t work as expected, this post is for you.

If you are not familiar, SignalFlow is the query language used in Splunk Observability Cloud for analyzing metrics.

I’ll assume you are:

  • Using Splunk Observability Cloud metrics with Signalflow queries.
  • Want to observe how your services are performing, if there are bugs, performance issues or service degradation.

This post aims to get you to a place where you can quickly troubleshoot queries, avoid trouble in the first place, and spend less time on this part of your job. To do that, I go over some key concepts, that once you understand, will solve most puzzling things about your Signalflow queries not doing the right thing.

The concepts are listed below, and we’ll tackle them one by one.

Metrics – Basic Definitions

Let’s define a couple of terms related to metrics:

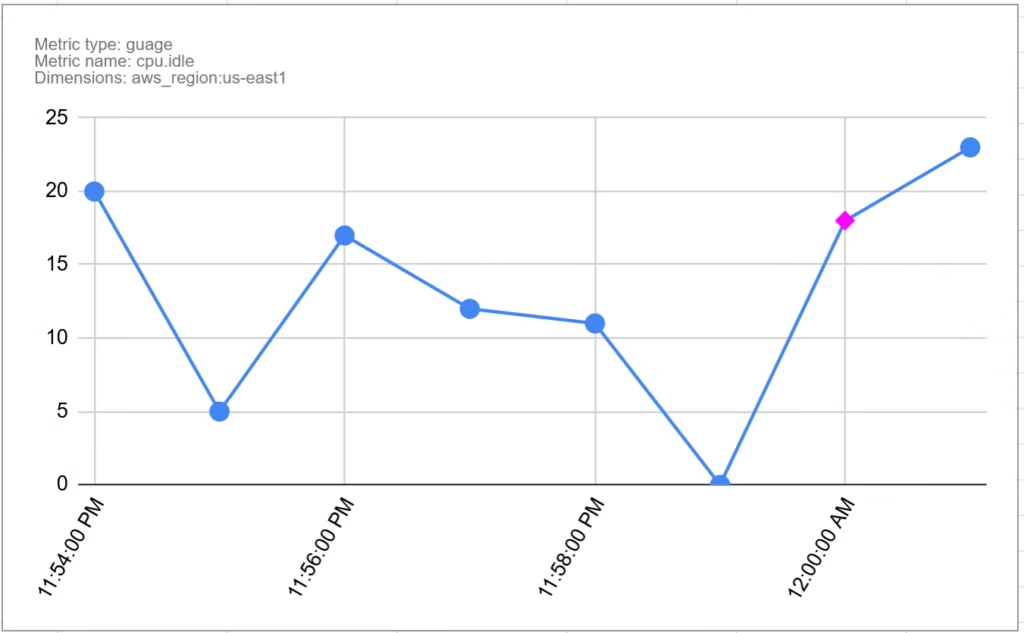
A metric is a single measurement at a specific point in time, e.g. (2026-01-04 00:00:00, 18), visualized here, with metric shown as pink diamond:

A metric data point is a metric with some metadata. It has the following values:

  • Timestamp — the time — usually to 1 second precision, can be lower resolution if configured.
  • Metric value — e.g. 15
  • Metric type — can be counter, cumulative counter, or gauge:
    • A counter counts events since the last report
    • A cumulative counter counts events since process start
    • A gauge measures a value at a point in time (e.g., current CPU usage)
  • Metric name — e.g. cpu.idle
  • Dimensions — a set of key-value pairs to tag the data point. Can be anything, example is aws_region:us-east1

This is shown below. It is the same chart as before with the additional metadata, and the pink diamond is now the metric data point:

Metric Time Series, or MTS

A metric time series (MTS) is a collection of data points that have the same metric and the same set of dimensions. In other words, it is a series of Metric Data Points. For example:

Time Value Details
11:54:00 PM 20

Metric Name:

cpu.idle

Dimensions:

aws_region:us-east1

11:55:00 PM 5
11:56:00 PM 17
11:57:00 PM 12
11:58:00 PM 11
11:59:00 PM 0
12:00:00 AM 18
12:01:00 AM 23

There is an MTS for every recorded combination of:

  • Metric Name, e.g. cpu.usage
  • Metric Type, e.g. gauge
  • Unique set of dimensions, e.g. hostname:server1,location:Tokyo

Note: it is possible to have two metrics with the same name and different types, but it is best not to do that. They discourage it in the docs here.

Dimensionality

There is an MTS for every combination of dimension values. The number of MTS grows quickly as dimensions are added, or new values added to dimensions.

For example, if you have a metric, with a server dimension with 100 values, and an operation dimension with 50 operations, and all combinations get used, you have 5000 metric time series. Having thousands isn’t necessarily a problem, but having many millions might be.

This is why we try to avoid high dimensional in metrics. For example if you use a URL as a dimension, the problem could be it may include query data, e.g. /user/1003332/post/8883 which would create a lot of time series.

Data Blocks

Now we know how the data is represented, the start of any SignalFlow query is the data block. The data block is where you define which metric(s) you want to gather data from, what filters you want to apply.

For example:

data('cpu.utilization', 
     filter=filter('host', 'hostA', 'hostB') and filter('AWSUniqueId', 'i-0403'))

This creates a data stream based on the metric cpu.utilization, and uses filters to only pick up data for specified values of dimensions. In details:

  • The data block defines that we want to extract data from MTS, and specifies the name of the metric.
  • The filter parameter defines how we want to filter all the MTS streams down the the ones we need.
  • The output of this is the collection of MTS streams for the metric name that have the dimensions specified by the filter.

This is combining the various MTS into a single stream. In this case, it is combining all of these:

  • All cpu.utilization MTS with host=hostA and AWSUniqueId=i-0403
  • All cpu.utilization MTS with host=hostB and AWSUniqueId=i-0403

If there are other dimensions, then there can be multiple MTS with the same host and AWSUniqueId that need to be combined.

The data block produces a stream, but to produce a chart the engine must bucket values up into time intervals, e.g. 1 minute or 1 day. What is the time interval set to? Can you control it? On to that next.

Resolution

The resolution defined the period of time MTS are bucketed in to for analysis. For example it could be 1 minute, and therefore the Metric Data Points will be aggregated into 1 minute buckets for the purpose of charting and rollups.

The use of an unexpected resolution can easily trip you up, especially when using detectors and debugging why a detector did or didn’t go off given the sent data. We might cover detectors in a future post, but if you are not familiar they are rules to trigger alerts on certain conditions.

SignalFlow usually determines the single resolution for a job by following these steps:

  1. Determining the resolution for long transformation windows or time shifts that retrieve data, for which only a coarser resolution is available.
  2. Analysis of the resolution of incoming metric time series.

You can control the resolution in part 1 by using the resolution parameter of the data block. Resolution coarseness caused by Part 2 is also worth watching out for, you can experiment and remove time shifts etc and see if this reduces the resolution to what you expect.

Here is an example of setting a 1 hour resolution on a datablock:

data('cpu.utilization', 
     filter=filter('host', 'hostA', 'hostB') and filter('AWSUniqueId', 'i-0403'),
     resolution='1h')

Rollup vs. Analytics

There are two types of aggregation that happen in Signalflow, and this really had me puzzled for a while, as why do I want to aggregate twice, and what happens if I choose a different aggregation for them?

The difference is Rollup aggregates over time, and analytics aggregates over dimensions. Let’s dive into that a bit more.

Rollup

A rollup decides how to aggregate the MTS into the given time resolution. For example given this MTS from earlier, let’s do an average rollup over a 2 minute resolution. The result is every 2 minutes, we take the mean average of the (in this case) 2 values. Here is the original MTS again:

Time Value Details
11:54:00 PM 20

Metric Name:

cpu.idle

Dimensions:

aws_region:us-east1

11:55:00 PM 5
11:56:00 PM 17
11:57:00 PM 12
11:58:00 PM 11
11:59:00 PM 0
12:00:00 AM 18
12:01:00 AM 23

Here is the rollup:

Time Value Rollup
11:54:00 PM 20 12.5
11:55:00 PM 5
11:56:00 PM 17 14.5
11:57:00 PM 12
11:58:00 PM 11 5.5
11:59:00 PM 0
12:00:00 AM 18 20.5
12:01:00 AM 23

For the example we only looked at one MTS, but of course the rollup applies to all of the combined MTS in the query. The resolution as mentioned earlier is determined by factors including the original stream resolution, the specified resolution in the data block, and any other operations that may make the resolution courser.

Analytics

Analytics methods allow you to aggregate again—this time over dimensions. By default, i.e. if you don’t use analytics, you get a stream for every single combination of dimensions. You may sometimes see charts with so many colored lines it is hard to read. These probably have not been aggregated using analytics.

You can aggregate all of those lines into a single line using an aggregation function of your choice. Choices of function include count, floor, mean, delta, minimum and maximum. More details are here.

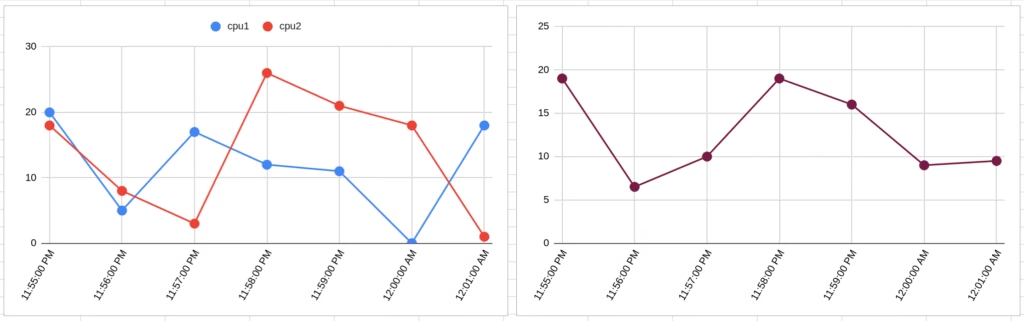
The example below shows this, on the left, without analytics, there are 2 MTS shown as separate lines. If we then apply the mean analytic function, we get a single line with the mean:

As signalflow code, these would look something like:

data('demo.cpu.utilization').publish('chart1')
data('demo.cpu.utilization').mean().publish('chart2')

Maybe you don’t want to collapse all lines into one line? Then you can also choose to group by dimensions. For example if you have MTS with dimensions for cpu number and host, you could do this:

data('demo.cpu.utilization').mean(by=['host']).publish()

Which would give you the average cpu utilization across cpus for each host.

Hopefully this helps you get started with Signalflow. Finally here are some entry points into Splunk documentation if you want to read more:

Image by PublicDomainPictures from Pixabay

Blocking large requests in Go using http library

If your server never expects over 100kb in a single request, you can block oversized requests to protect against abuse. You could block them in a reverse proxy, e.g. NGINX, but you can also block them in application code. Here I will talk about the latter, since this can be useful if you don’t have a reverse proxy, or you need fine control over the limiting.

Blocking a large request, by counting the bytes

Let’s say you want to block requests over 100kb. This is something I looked into for a recent project. My first thought when looking into this was to replace the body with a reader that closes after it consumes 100kb and throws an error. As it happens there is reader built into the http library called MaxBytesReader that does exactly this, so you can do something like this.

http.HandleFunc("/", func(w http.ResponseWriter, r *http.Request) {
    maxBytesReader := http.MaxBytesReader(w, r.Body, maxBytes)
    ...
}

The great thing about doing it as a reader is you don’t really impact performance that much, you do the read you’d do anyway. This is as opposed to say reading the whole body into memory, then realizing it is 100mb, wasting memory, and then rejecting the request.

One thing to note is that the user of maxBytesReader needs to determine what to do when the reader returns the error reporting the max size has been reached. It will need to determine that if it is a too large error then return the response code. Like this:

var maxBytesError *http.MaxBytesError

body, err := io.ReadAll(maxBytesReader)
if err != nil {
	if errors.As(err, &maxBytesError) {
		w.WriteHeader(http.StatusRequestEntityTooLarge)
		fmt.Fprintf(w, "Content Too Large")
	}
} 

Next, let’s make the typical case more efficient. Most requests will send the size of their payload in the header, so we can block earlier if we know the request will be too big. Let’s look into that.

Blocking a large request using content-length header

The HTTP/1.1 content-length header is an highly recommended (but technically optional) field to indicate how much data you intend to send in a request or response.

We can use this header to block a request that is too large before even reading the body. However we can’t trust that it will be set, or if set that is is accurate, so you will want to combine this with counting the bytes.

Combining the two methods, looks like this:

http.HandleFunc("/", func(w http.ResponseWriter, r *http.Request) {

	if r.ContentLength > maxBytes {
		w.WriteHeader(http.StatusRequestEntityTooLarge)
		fmt.Fprintf(w, "Content Too Large")
		return
	}

	maxBytesReader := http.MaxBytesReader(w, r.Body, maxBytes)

        ...
}

That is it. We are all done! Now let’s now visit a couple of things related to this of interest…

Additional Notes

Sometimes the http server will check body length, but don’t rely on that.

Go’s http server (see transfer.go) will limit the reader to only read a number of bytes equal to realLength which is usually set to content-length, but only if the content-length is supplied, and there are various conditions around whether it will do it or not. This is a good feature, but not 100% reliable for the purpose of blocking large requests to protect your service.

Here is the code inside the Go http library that does this:

func readTransfer(msg any, r *bufio.Reader) (err error) {

//...
	switch {
//...
	case realLength > 0:
		t.Body = &body{src: io.LimitReader(r, realLength), closing: t.Close}
//...

LimitReader vs. MaxBytesReader

There are two similar readers for limiting request size, io.LimitReader and http.MaxBytesReader. Here is what the documentation says:

MaxBytesReader is similar to io.LimitReader but is intended for limiting the size of incoming request bodies. In contrast to io.LimitReader, MaxBytesReader’s result is a ReadCloser, returns a non-nil error of type *MaxBytesError for a Read beyond the limit, and closes the underlying reader when its Close method is called.

MaxBytesReader prevents clients from accidentally or maliciously sending a large request and wasting server resources. If possible, it tells the ResponseWriter to close the connection after the limit has been reached.

And for the complete picture, the docs for LimitReader:

LimitReader returns a Reader that reads from r but stops with EOF after n bytes. The underlying implementation is a *LimitedReader.

If we used a LimitReader, we wouldn’t know that the client had sent too much data, and instead continued processing the request, likely hitting an error later because the payload is truncated.

Unit test mocks in Go

Recently I have been using Go for the first time seriously. Go is famously easy to learn for programmers from other languages, and I found this to be true. However, performing mocking in Go unit tests required a bit of my head scratching, so I’ve decided to write about it!

This post explores different ways you can mock in Go, and the tradeoffs involved between them.

What is test mocking?

It’s good to go over the definitions of mocks. I am going to use these definitions, taken from Martin Fowler’s article on mocks vs. stubs, which are in turn taken from Gerard Meszaros’s book xUnit Test Patterns, with my minor edits for brevity. Don’t worry about remembering all of this—I’ll recap as I use them:

Test Double is the generic term for any kind of pretend object used in place of a real object for testing purpose, can be one of:

  • Dummy objects are passed around but never actually used. Usually they are just used to fill parameter lists.
  • Fake objects actually have working implementations, but usually take some shortcut which makes them not suitable for production (an in memory database is a good example).
  • Stubs provide canned answers to calls made during the test, usually not responding at all to anything outside what’s programmed in for the test.
  • Spies are stubs that also record some information based on how they were called. One form of this might be an email service that records how many messages it was sent.
  • Mocks are what we are talking about here: objects pre-programmed with expectations which form a specification of the calls they are expected to receive.

I am going to show how to do various test doubles in Go, some of which are mocks.

Test doubles help reduce the computational cost of a test, and make setup simpler (no need to create a DB, for example). They tend to help make more reliable and focused tests.

Download-a-cool-RSS-feed example program.

We will get started with testing, but we need something to test. The program we will use for our examples downloads the feed of (perhaps) your favorite programming blog. Feel free to change the URL!

It’s simple enough, but there is enough complexity here to demonstrate different types of testing. Here is the code:

package main

import (
	“io”
	“log”
	“net/http”
	"os"
)

func main() {
	err := Download("https://martincapodici.com/feed", "feed.xml")
	if err != nil {
		log.Fatalln(err)
		os.Exit(1)
	}
	log.Println("Download complete")
}

func Download(url string, fileName string) error {
	resp, err := http.Get(url)
	if err != nil {
		return err
	}

	defer resp.Body.Close()

	file, err := os.Create(fileName)
	if err != nil {
		return err
	}
	defer file.Close()

	_, err = io.Copy(file, resp.Body)
	return err
}

You can try this now, by copying this into main.go and running the command:

go run main.go

This code has a function Download(...) that performs IO, both to make an HTTP call, and to save the result to disk. I am looking to unit test this without doing any real IO, so I need to change this a bit so it can be run with or without IO. My first job is to modify the function so that mocked IO is an option.

I will create an interface called IO that will expose CreateFile() and GetUrl() methods. I can then create mock implementations of that interface.

First let’s add the interface that lets this method do the IO things it needs to do:

type IO interface {
	GetUrl(url string) (resp *http.Response, err error)
	CreateFile(fileName string) (file io.ReadWriteCloser, err error)
}

The file is passed using the io library interface ReadWriteCloser, to make it swappable for a test object.

You might notice the absence of an interface for the io.Copy call. Since io.Copy works with interfaces, it is already test-ready.

Here is the io.Copy documentation to prove it works with Reader and Writer interfaces:

// Copy copies from src to dst until either EOF is reached
// on src or an error occurs. It returns the number of bytes
// copied and the first error encountered while copying, if any.
// ...
func Copy(dst Writer, src Reader) (written int64, err error) {

Anyway, lets get this done! We now will implement the real (i.e. not test) methods for the interface. We need a “receiver” object to attach the methods to. Since there is no state we need to keep, this is an empty struct that we will call RealIO:

type RealIO struct{}


func NewRealIO() IO {
	return &RealIO{}
}

Here are its methods:


func (r *RealIO) GetUrl(url string) (resp *http.Response, err error) {
	return http.Get(url)
}

func (r *RealIO) CreateFile(fileName string) (file io.ReadWriteCloser, err error) {
	return os.Create(fileName)
}

The download function can now use the interface instead of direct library calls:

func Download(testIO IO, url string, fileName string) error {
	resp, err := testIO.GetUrl(url)
	if err != nil {
		return err
	}

	defer resp.Body.Close()

	file, err := testIO.CreateFile(fileName)
	if err != nil {
		return err
	}
	defer file.Close()

	_, err = io.Copy(file, resp.Body)
	return err
}

Finally, we can update the main program to provide this. A one line change:

err := Download(NewRealIO(), "https://martincapodici.com/feed", "feed.xml")

Testing the app, using mocks (and friends)

We will now look at a few ways we can test the code above. We’ll start with the pure Go solution, then use a library, and then touch on code generation options.

Testing with vanilla Go: Or, just use the interface

Without importing any external libraries we can create a test double that implements the IO interface, providing test data and recording calls.

However, before we get to that, lets create a fake file as well need that for constructing the test and for the interface implementation.

I have chosen to fake the file using a buffer (bytes.Buffer). A buffer is basically bytes in memory that happens to have the same Read and Write methods as a file—so swapping in a buffer for a file should be easy enough.

Buffer + Close() = What we want

A buffer however doesn’t have a Close method, so we need to add one. But how do we do this when bytes.Buffer is a standard library object we can’t modify?

To make a buffer that is a ReadWriteCloser the following code uses a technique called struct embedding. Struct embedding is syntax sugar, meaning it’s short hand for something that would normally need more code.

Struct embedding lets you to make a struct a field of another struct and have all of the functions defined on that struct be part of the outer struct.

If this is confusing, it should become clear when you see the code or try this code out for yourself and experiment.

With struct embedding we can embed the buffer in a new struct, called InMemoryFile that gets given the Read and Write methods from the buffer. We then add the additional Close method so that InMemoryFile implements the entire ReadWriteCloser interface:

type InMemoryFile struct {
	bytes.Buffer
}

func (f *InMemoryFile) Close() error { return nil }

// + Struct Embedding Magic! InMemoryFile's Read() and Write() functions are implemented behind the
// scenes by Go so we don't have to write them by hand. What do they do? They just call
// the Read() and Write() functions of the buffer.

We will now create a TestIO struct, that will be used to sort-of act like the real IO, and also help us make assertions for the test.

Lets define the struct and a function to create a new instance. We have an InMemoryFile in our struct so we can fake the file:

type TestIO struct {
	file InMemoryFile
}

func NewTestIO() *TestIO {
	file := InMemoryFile{*bytes.NewBuffer(nil)}
	return &TestIO{file}
}

The interface for IO has two methods that we need to implement. The first method is GetUrl, which is set up to return an OK response for a test URL, and otherwise an error:

func (f *TestIO) GetUrl(url string) (resp *http.Response, err error) {
	if url == "http://testurl" {
		resp = &http.Response{
			StatusCode: http.StatusOK,
			Body:       io.NopCloser(strings.NewReader("OK")),
		}
		return resp, nil
	}
	return nil, errors.New("error")
}

The CreateFile method is next, and will return the fake file, or an error:

func (f *TestIO) CreateFile(fileName string) (file io.ReadWriteCloser, err error) {
	if fileName == "testfile" {
		return &f.file, nil
	}
	return nil, errors.New("error")
}

This is a test double object that is pretty hard wired for a specific kind of test. Hint hint! (there is a quiz question later!)

So we now have enough scaffold to do a basic test that simulates a file download, and checks that the mocked file has the correct contents:

func TestDownload(t *testing.T) {
	testIO:= NewTestIO()
	err := Download(testIO, "http://testurl", "testfile")
	if err != nil {
		t.Error(err)
	}
	b := testIO.file.Buffer.String()
	if string(b) != "OK" {
		t.Errorf("expected file to contain 'OK', got %s", string(b))
	}
}

This is only tests one scenario, and doesn’t test different kinds of IO errors. To do that we’d need to extend the test double to do more, and possibly record values that are passed in to them.

Doing this by hand gets tedious, so we will look into how to make this less work with mocking libraries. There are two good options I have seen, and we can weigh up pros and cons after.

Quick quiz

What kind of test double is TestIO? (Revisit the definitions under What is test mocking if needed.)

Use the stretchr/testify/mock library

The stretchr/testify/mock library is straightforward to use. It’s hard to beat the example given on https://pkg.go.dev/github.com/stretchr/testify/mock#hdr-Example_Usage for a description of how this library works and how to use it. Please read that first.

In short though the idea is your mock struct embeds the mock.Mock object, which you then use in each method you want to implement in the mock, to pass in the given parameters and return mock values that were set up in the test.

Here is how to use it for our example. First install it:

go get github.com/stretchr/testify/mock

Then in a new test file, say main2_test.go, we can create the mock, along with the interface methods that delegate the work to the mock. Each method passes it’s arguments into Called to tell the mock it was called, and then the mock returns the result that can be deconstructed. Nothing specific is set up yet; we get to control the behavior from the test code.

type MockIO struct {
	mock.Mock
}

func (m *MockIO) GetUrl(url string) (resp *http.Response, err error) {
	args := m.Called(url)
	return args.Get(0).(*http.Response), args.Error(1)
}

func (m *MockIO) CreateFile(fileName string) (file io.ReadWriteCloser, err error) {
	args := m.Called(fileName)
	return args.Get(0).(io.ReadWriteCloser), args.Error(1)
}

I also like add a line that asserts that MockIO has implemented the IO interface correctly. This gives you immediate feedback via the IDE if the interfaces is not properly implemented, plus it prevents the code from compiling if such an issue exists:

var _ IO = (*MockIO)(nil)

With this in the place we can now have a succinct test that defines how the mock should behave, then tests the function with that behavior. The rather haphazard fake implementation used earlier is replaced with just two testIO.On statements:


func TestDownloadUsingMock(t *testing.T) {
	testIO := new(MockIO)

	file := &InMemoryFile{*bytes.NewBuffer(nil)}

	resp := &http.Response{
		StatusCode: http.StatusOK,
		Body:       io.NopCloser(strings.NewReader("OK")),
	}

	testIO.On("GetUrl", "http://testurl").Return(resp, nil)
	testIO.On("CreateFile", "testfile").Return(file, nil)

	err := Download(testIO, "http://testurl", "testfile")
	if err != nil {
		t.Error(err)
	}

}

Hopefully you can see that it is now much easier to test other scenarios without needing to change the mock implementation. In addition to the On/Return pattern shown here there a multitude of behaviors available in the library, as well as the ability to bake in expectations e.g. the function should be called exactly once. There is also a MatchedBy argument you can use to specify a function that determines if an argument, for example, this could be used in the test too:

	testIO.On("GetUrl", mock.MatchedBy(func(url string) bool { return strings.Contains(url, "testurl") })).Return(resp, nil)

These features make it strictly better than building your own fake implementations in my opinion, which some rare exceptions.

An example of where a fake might be preferred is you want the fake to act like the real object by maintaining internal state. For example where the real object talks to a Redis cache, and the fake object uses a crude in-memory cache, and consumers want to test their code integrated with that cache. In a test where the function you are testing is making heavy use of the cache, it might be less attractive to set up all of the possible interactions in a mock.

Mockery

I’ll give a quick shout out to mockery, a tool that generates your stretchr/testify/mock mocks. https://vektra.github.io/mockery/latest

The benefit of this is not typing out a lot of boilerplate, but the downside is perhaps having mocks for things you never need, and adding bloat to your code base.

Check out their documentation if you want to use it. I haven’t yet decided if I prefer Mockery, or hand writing mock objects as needed. If you have an opinion or know of other interesting Go mocking libraries, please let me know, e.g. leave a comment.

Image by Bianca Van Dijk from Pixabay

Production tests: a guidebook for better systems and more sleep

Your customers expect your site to be fully working whenever they need it. This means you need to aim for near-perfect uptime not just for the site itself, but for all features customers may use.

Modern software engineering uses quality control measures such as automated test suites and observability tools (tracing, metrics, and logs) to ensure availability. Often overlooked in this landscape is production tests (also known as synthetics) that can give you immediate notification of failures in production.

Production tests can be setup up with minimal fuss—usually within one sprint—and can provide a high return on investment. In this post, I will cover how to best set up production tests and how they can help with reliability, deployments, and observability.

While I have always liked production tests, I got a real appreciation for them at Atlassian, where they are used extensively and are called “pollinators”, and I have seen first hand how they can give early warnings of problems, which can be fixed before the become incidents.

What are production tests?

A production test is any automated test that runs on the production environment. The test runs on a frequent schedule so that an on-call engineer can respond quickly. Typically, they run every minute. The test might use a headless browser to emulate user actions, or it may use an API directly to emulate the actions of browser code or backend service.

The production test should run in a reasonable time. I suggest 30 seconds or less, so that you can run the test easily once per minute. A test that takes longer than 30 seconds is probably to complex anyway for a production test. How the test deals with failure is up to your team. It could integrate with your on call paging system, send a Slack notification, or just log an error into your logging systems.

How do production tests help?

Productions tests help make your production environment more reliable by giving immediate warning of a regression. This means you can potentially fix issues before a customer discovers them.

In addition, the production test can be used as a canary before deployments, and as such acts as an integration test. The test can detect regressions that are caused by mismatches with other services, such as API shape or error-handling issues. You can run the test when deploying to development and staging environments too, to get a warning of an issue during development.

You also make it easier to debug production issues by having production tests. If you have an issue you are investigating, knowing which production tests are working and are failing gives you insight into what the issue might be. If you rely on other team’s services, and they also have production tests, you can look at their tests too to help with diagnostics.

Having production tests will reduce the time to recovery for any incident where a human has to fix it, as the engineer learns about the issue sooner, and has more information at hand to resolve it.

Important design considerations for production tests

For production-tests to be worth having, they need to be well-thought-out. If the test keeps failing it’ll probably get silenced and ignored. Even if the test is reliable it can cause other problems, such as resource usage impacting downstream systems. You may even have to change your systems to be a bit more testable. Here are some tips to consider when setting up your production tests:

Keep your production tests basic

Your production tests should cover less ground than your automated test suites. You want the tests to be reliable enough that they don’t waste your time with false alerts, which leads to frustration, lost time and possibly disabling of alerts. The goal of a production test is to be the canary that something has gone badly wrong. It gives you a head start on fixing it, hopefully before a customer gets affected.

To illustrate the required simplicity, here are some examples of what I think are good candidates for a production test:

  • Log in, and confirm you are on the home page, showing that user’s name.
  • Load the main editor of your app and type in Hello. Confirm Hello is there. Reload the browser and confirm Hello is still there.
  • Call 4 API endpoints to do CRUD operations for your microservice, using possibly some fake data in the API.
  • Ping /health and check for 200 response code within 250ms

Contrast this with these more complex and problematic production tests:

  • Run through a 25-step test that checks all the main functionality of the editor, asserting that elements are the correct size and are in the correct position.
  • Test that if you make call in quick succession to the API, they will be added to the database in the same order.
  • Check that the credit card page can differentiate between Visa and Mastercard based on the card number.
  • Ping /health and check for 200 response code within 1.5ms

The first examples are good because they are quick, reliable, and simple. They are not too functionality-specific, are so are unlikely to be broken by feature changes.

The bad examples on the other hand have problems:

The 25-step test will likely be flaky due to browser automation quirks, and feature changes. You will spend a lot of time investigating failures to the test, and concluding “It was just a one-off” or “Oh! It’s because we moved a button”.

The API calls in quick succession will sometimes fail due to network conditions changing the order in which the requests are received. It is not necessary to do something sophisticated in a production test—your goal is to know if something is horribly broken, not detect subtle timing issues.

The credit card test is probably OK in terms of not being flaky, but is a little too specific. You can almost entirely de-risk a bug in credit card UI behavior with tests that run before deployment, so do that instead.

The health check test expecting a fast response is likely to fail often enough to cause alarms that have no meaningful response. There are better ways to monitor latency in production that I will cover in a future post.

But… try go get some decent coverage

You are not aiming for anything near 100% code coverage, in fact code coverage doesn’t really matter here. That said, production tests should cover more than just “load the home page”. This is an art, but a guiding idea here is “if there is a serious problem, how likely are my production tests to detect it”. You are balancing that up with “how frequently will I get false reports of an outage”.

You also may want to think about the value of the things you are testing. Is it a minor feature used by 1% of users, or is it the page where new customers sign up? The latter is particularly important for growth companies who rely a lot on customer self-servicing to try out their software.

You don’t have to get this completely right from the beginning. You can add more tests next week. Furthermore, you can edit your existing tests, or even remove them too. Err on the side of too little coverage to begin with and consider adding more later. This way your team will get used to owning, tweaking and responding to production tests, without a cacophony of alarm bells!

As a rough guide, I would say test 3-5 simple things to begin with, with the goal to eventually move towards a reasonable amount of coverage. What is reasonable? You’ll find out after trying things out, and discussing outcomes with your team. There is no correct answer here.

Production tests are not health checks, but may overlap with them

A health check is usually a simple check that the server is running. For example, if using Node.js and Koa or Express, you might add a health route that just returns a success response on any invocation.

The purpose of this check is to assess basic server health. It allows load balancers to know which nodes to send traffic to, and deployment pipelines to know when a deployment has completed (or failed).

We expect these health checks to fail in production, possibly without affecting the customer. For example if a machine goes offline, the load balancer will detect this and stop sending traffic to that node. However, if there is no adverse effect of this on the consuming service or customer then there is no urgent problem. The system has self-healed.

Calling this health check on a node as a production test is not advisable, as it will cause false alarms. Even if it didn’t, a health check is not a good indicator of user experience.

The term “Health check” is also sometimes used to refer to checks that do more that just check the server is up. E.g., they may check dependencies such as storage systems, caches, queues and so on. A production test that calls such a health check could give early warning of an issue before it becomes noticeable by customers.

Be mindful of how your production tests affect observability

Running a test every minute, or 1440 times a day, will show up quite a lot in logs, metrics, and traces. This is often a good thing, because regions or services with very low traffic are now a bit more “observable” than they would be without such tests.

The downside is it may add costs by keeping resources spun up in those regions. Another downside is that being fake traffic, and sometimes requiring fake data (such as a fake user ID) can add noise to the logs you will sometimes need to filter out.

Fake data considerations

Consider a monolithic application — a single server that serves a website and all of its functionality. You need to write a test that logs in, enters some data in a field, saves it and checks it got saved. Such a test has a few challenges.

Firstly you need to decide how it logs in. Does it have a real account? If it does—what stops that account from expiring (e.g., from a free trial). You may need a discount code or special “fake credit card” that the system knows is for testing. If it is a “fake” account then how does that work? Is it hard coded somewhere.

The test is now generating data on each run. Will the success or failure of a previous run affect the current run of the test. Will running the test thousands of times a week use up storage space?

Think about these issues when planning the tests.

The tempting thing is to do the easiest thing to get it done. E.g., create an account using your staff email, worry about storage later, just get it working. This can come back to haunt you if the test breaks later, and you need to deal with upgrading the account, or maybe the member of staff whose email was used is on leave.

Making a production system testable may take some work and have special switches, such as user fields, or feature flags so that the behavior can be slightly different to facilitate the test.

If you use microservices, or a monolith with a separate auth service, there are ways to avoid needing a test user account. For example if your service uses a JSON Web Token (JWT) to authenticate, the authentication server could support logins for test systems, and your service can declare which tests it is authorizing to call it.

Three strikes before an alarm

If you have enough production tests, and run them on enough systems for long enough you will get false alerts. These can be caused by all sorts of things, network problems that only affect the test side, quirks in browser automation, or a genuine problem that heals itself two seconds later.

The simple way to avoid getting these kinds of false alerts is to wait for three consecutive failures before raising any alarm.

You might be giving me a side eye right now though, because should we be ignoring these false alerts? Probably not. If you have a team ritual of looking through operations data, you can incorporate non-alerting production rest failures into that ritual. The idea is that you prioritize it like any regular work, rather than making it an urgent thing that requires people to work out of hours, or stop their regular work.

Pros and cons of production tests

What is good about testing in production? I have hinted at a few of these already, however let’s get into the details:

  • Real world testing: Test suites—including unit tests and locally-run integration tests—that run on every build are definitely needed. However, even with all of there is nothing quite like test-driving the finished car, and that is what production tests are for. The proof of the pudding is in the eating.
  • Quality Control: The main reason for running tests is to know something is broken. Despite all the automated and manual testing you do on your machine and in staging environments, production is always unique. There are some things that only happen they way they do in prod. And even if your staging environment is precisely the same, generally speaking production will have more traffic. Running tests in production let you know if certain things are working in production.
  • Troubleshooting: If there is an incident where customers are impacted by a bug or outage, the tests are very useful. They may be failing or passing, but either way, their current state tells you something about the system, and can help narrow down the problem.
  • Observability for low traffic regions: If you deploy your service to multiple regions and some of those regions don’t get much traffic, the production tests will create synthetic traffic. Your observability metrics such as latency and reliability percentiles will be more meaningful with even just 1000 calls per day, than with close to zero traffic.
  • Safer Deployments: The same tests you use to monitor production can double up as tests you run to accept a blue/green deployment. These tests are then acting as continuous integration tests of last resort, adding to the assurance that your deployment won’t cause big issues.
  • Reuse in other environments: Just as you can use these tests for safer deployments, you can also use them in dev and staging environments, to get early detection of issues that your build pipeline cannot detect, such as integration issues with other services.

There are, of course some disadvantages to using production tests:

  • Setup and teardown challenges: Tests run on the real system, so you cannot wipe the database before each run. You need to figure out how to best set up the specific scenario you want to test for, and how to clean up after the test.
  • They sometimes need setup of scenarios: For example you have a test than you can upgrade your account, but you need an account set up that needs to be upgraded, and a fake payment method that will be accepted. These scenarios may mean changing production code to support them too.
  • They can be flaky: Any test that runs on a real system can fail from time to time for various reasons. For example network issues between the test and the service or occasional timing issues in the browser the test uses. Flakiness of tests needs to be taken into account if you intend to wake someone up when the test fails.
  • They cause resource usage and costs: Running tests do cost. Often tests are run across different geographic regions to ensure they are tested well, and hundreds of times a day. That compute cost adds up.
  • Human cost in maintaining tests: Not every test fail is an issue, but it does need to be investigated. Too many tests could leave you with a full-time position monitoring and making those tests more robust.

Production tests, vs. observability

You can also “test production” though monitoring of real traffic, and looking for problems there. This deserves a post or series of its own, but in short you can check for things like:

  • Latency, e.g., alert me when the top 99-percentile of latency for a particular endpoint is > 200ms, for 3 periods in a row.
  • Reliability, e.g., alert me when more than 0.1% of requests fail with a 5xx code.
  • Assertions, e.g., alert me when a code path that is considered unexpected or impossible has been triggered.
  • Failures, e.g., alert me when a customer couldn’t perform a task because they got an error.

The good thing about observability-based alerts is they are very simple to set up. It may need some minor code changes, and then setting up detectors in observability tools, that take look for and take an action when the condition is met.

These tests pair well with production tests. They have a different purpose though, since they detect problems after they have happened, and they piggyback on existing system use. They can be helped by production tests creating additional synthetic traffic which they can then monitor, which lets you keep checking things when natural traffic levels fall off.

There is no “versus” though! You would do well to have both. For a particular need it might be better to use a production test or better to use observability. A rule of thumb is if observability can meet the requirements of alerting you to a problem, then it will be easier to set up and tune to your needs than a production test.

Summary

Phew! We covered a lot of ground there. In a nutshell adding well-designed production tests to your systems will help in a number of ways. You’ll get earlier warnings of issues, you will be able to fix them faster, you will get observability benefits, and you can also use production tests as a deployment rollout test.

It is worth adding production tests if you are not doing so already—it is a relatively small task to fit in to your planning, and you will reap rewards. If you are already using them, keep reviewing them, and see what you need to add, remove and tweak to get the most value from them as your systems evolve.

Happy testing!

LanguageTool — Check your writing the open-source way

If you write anything (so that’s a yes) then an in-browser spelling and grammar checker can be handy. Even if all you write is emails!

A checker that is free and good, and easy to use, is LanguageTool. As a bonus, it is open-source too. The open-source version is a bit more technical to set up, and if you don’t want to do that, they have a paid cloud version. However, it isn’t too hard to get going, as we will see below.

1. Install the browser extension

Install the LanguageTool Chrome Extension or Firefox Extension.

This will work as-is, and you can start using the tool to check your spelling on WordPress, Google Docs, Gmail and most other apps.

However, it will be limited to a certain number of words, and certain features.

You can either 1. live with that, 2. upgrade to the paid cloud version, or 3. perform the following steps to run it locally for free.

2. Run a local LanguageTool server

The instructions to do this are here: https://dev.languagetool.org/http-server

If you are lucky enough to use a Mac, there is a simple brew installation. Otherwise, I found the Docker method quite convenient, if you already have Docker installed. (If you don’t it is worth installing Docker Desktop or Rancher, as it is pretty handy for many things, including ephemeral “installations” of software like LanguageTool for example).

The docker images are maintained by different people, so there are a few options. One of these is https://github.com/meyayl/docker-languagetool, which I got working well locally. The command to do so is there, but I will repeat it here:

docker run -d \
  --name languagetool \
  --restart unless-stopped \
  --cap-drop ALL \
  --cap-add CAP_CHOWN \
  --cap-add CAP_DAC_OVERRIDE \
  --cap-add CAP_SETUID \
  --cap-add CAP_SETGID \
  --security-opt no-new-privileges \
  --publish 8081:8081 \
  --env download_ngrams_for_langs=en \
  --env MAP_UID=783 \
  --env MAG_GID=783 \
  --read-only \
  --tmpfs /tmp \
  --volume $PWD/ngrams:/ngrams \
  --volume $PWD/fasttext:/fasttext \
  meyay/languagetool:latest

3. Tell your extension to use the local server

Click the LT logo on your browser. It is either on the toolbar, or nested inside the extensions menu (jigsaw icon). It looks like this:

Click the settings (gear icon), and then scroll down to Advanced settings (only for professional users) and under LanguageTool server, choose Local server and click Save.

4. Try it out

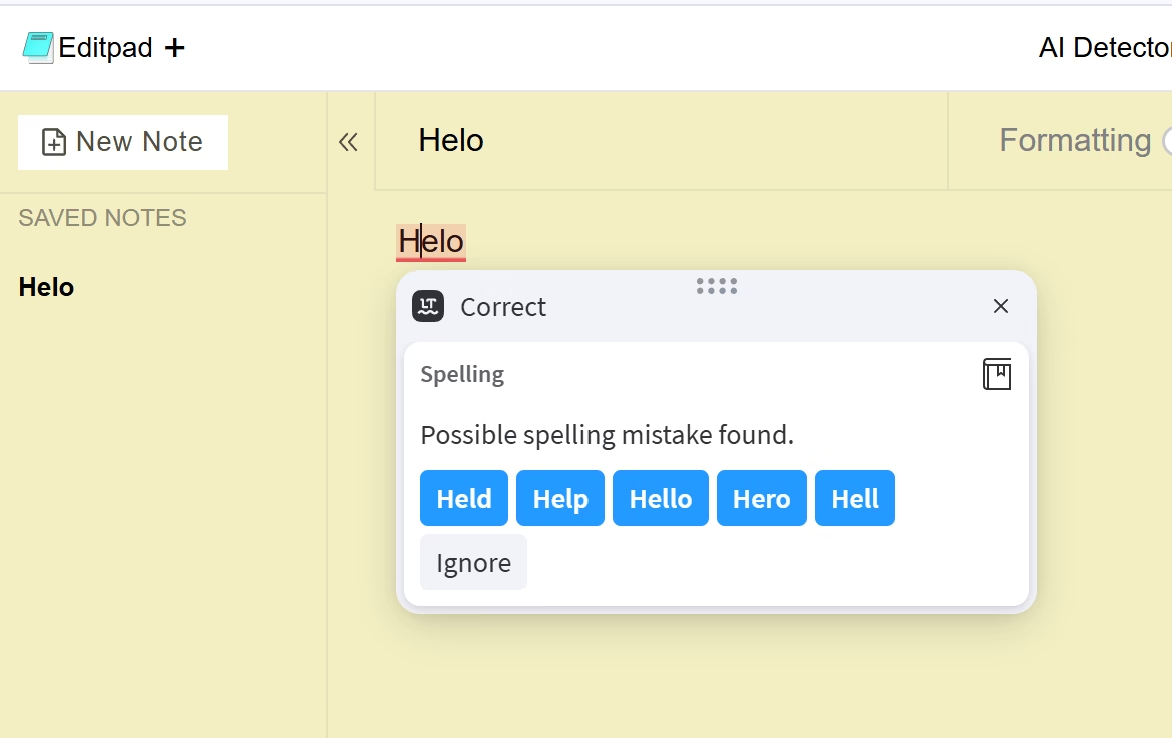
Open your favorite digital parchment, such as Google Docs, Confluence, or Notion, or anything else. For a quick try-out, it works here too: https://www.editpad.org/. Whatever you decide, when you open the page you should see a small blue circle with a tick, somewhere in the bottom right of the editing space.

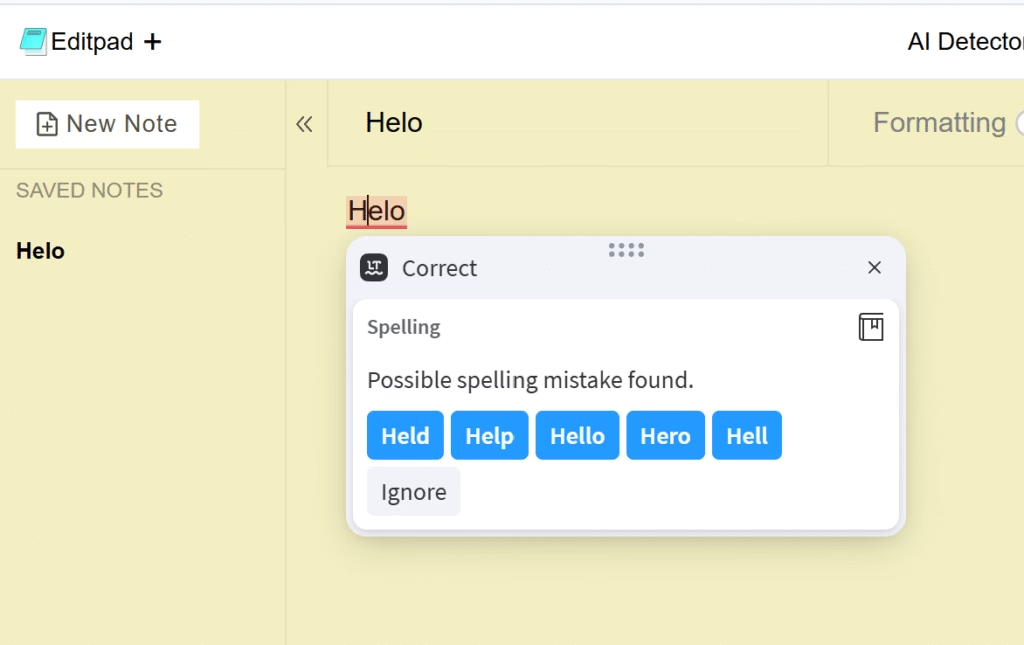
Type something with an intentional mistake, e.g., “Helo”, and you should see the circle go red, and the mistake is highlighted. You are now being watched! In a good way.

Coding Resources

A list of resources I have found useful for programming. Mainly for my own reference later:

Running local Python code on a remote GPU (using modal and lob.py)

I explored in a previous post how to run nanoGPT on modal – both the training and sampling. It was successful, but tiresome. There were a lot of changes to the downloaded code which made me unhappy. If I want to try different projects out that are on Github etc. I don’t want to be doing a lot of coding and fiddling just to get the existing code to run. I just want to run it as if I am running it locally. This is where my script lob.py comes in!

What is lob.py?

This is a Python script that provides a fairly easy way (all things considered!) to run your local code on a cloud GPU. It does this by running your code on Modal, and handles some of the logistics of doing so, such as uploading source code.

Let’s explore what it does, by doing what took 1.5 blog posts in 1 blog post, and train and run nanoGPT on Modal.

Using lob.py to train and run nanoGPT.

First, clone nanoGPT, and download lob.py from a public Gist (I may make this a full Github repo later, we will see).

git clone https://github.com/karpathy/nanoGPT
cd nanoGPT
wget -O lob.py https://gist.githubusercontent.com/mcapodici/eaa39861affe75be13badefbe9e05079/raw/bbc9e3cbb692277ffcf18406c61805685bf70d25/lob.py

Now set up a python environment you favourite way. I will use venv in this example:

python3 -m venv .
source bin/activate

Now you might want to add the following to .gitignore to avoid have lots of changes show up (this might differ if you used another Python environment tool)

bin
lib
lib64
share

Now install modal and log in, using their standard instructions:

pip install modal-client
modal token new

We will now set up the lob.py for our requirements. The version we downloaded is already set up for nanoGPT, but let’s review the contents of it’s parameters.

Setting up lob.py run parameters

The first one is just selecting what GPU you want to use. For nanoGPT, the cheapest one t4 is plenty enough for the task:

# Choose one of: "t4", "a10g", "inf2", "a100-20g", "a100" or None
gpu="t4"

Next we define the commands that run. These are run after copying all the local code files to the server and changing directory into that folder. We have a single command for each stage, but you can have multiple.

commands={
    'prepare': ['python data/shakespeare_char/prepare.py'],
    'train': ['python train.py config/train_shakespeare_char.py'],
    'sample': ['python sample.py --out_dir=out-shakespeare-char'],
}

Now we set verbose, which tells us what files are being uploaded, we set the name of the volume (so that we can keep our files for this project separate), a timeout of 60 minutes after which Modal will terminate the job and a list of paths to not upload:

verbose=True
volume_name_prefix="2023-07-27-10-45"
timeout_mins=60
exclude_paths_starting_with=["./.git", "./.github", "./bin", "./lib", "./share"]

Finally we define the image, which is how the container will be set up that will run the program. rsync is needed because it is used to copy up the right files (without losing generated files on the server). In addition we need to do the pip install defined in the README.md of the nanoGPT project:

image = modal.Image \
    .debian_slim() \
    .apt_install("rsync") \
    .pip_install("torch numpy transformers datasets tiktoken wandb tqdm".split(" "))

Train and run using lob.py

With all the set up done, running is very simple. Just run these commands one after the other. They correspond to instructions in the readme.md

modal run lob.py --command prepare
modal run lob.py --command train
modal run lob.py --command sample

Here is some output from the final phase:

ISABELLA:
This is the day of this is your land;
But I have been call'd up him been your tent?

DUKE VINCENTIO:
How far of the solemnity? who is wrong'd?
Why should we shame an arms stoop of life?
They will prove his like offence with life
And to be crave a happy model's guilty of his cheeks;
For all his foes, that are gone of me.

Here is the entire output of the 3 commands (click to expand):

Click to expand

Notes about how lob.py works

The script works by doing the following:

  • The is a function called copy (I should probably have called this copy_and_run) that runs on the remote machine, and copies all of the changed files from the local file system to the remote machine.
  • To this function we bind 2 directories that appear on the remote system:
    • /source/code is a mount that is a copy of your local folder, except for the folders mentioned in exclude_paths_starting_with. This is a (I think) temporary and (for sure) read-only folder.
    • /root/code which is a “network file system” which has been set up as persistent and read/write.
  • The copy function uses rsync to copy everything that has changed from the mount to the persistent file system. This means that future runs are quicker (they only need to copy changed files) and the running code can save data, such as model snapshots, and recover them on future runs.
  • Once copy has done with rsync it changes directory into the /root/code folder, then runs your commands.

Human-made Content